• Have something to say? Register Now! and be posting in minutes!

2012 Opening Day Heat Maps

gp956

The Hammer
13,846
1
36
Joined
Aug 11, 2010
Hoopla Cash
$ 1,000.00
- Does "Career heatmaps" mean "Career-since-PITCHf/x-has-been-around heatmaps" ?? (for the young players it doesn't matter, but for Huff it would)

Brain fart. The data is from 2008 on. In a way that's good since players change over time.

If a batter NEVER swings at a pitch in a certain place, his wOBA would be 0 (very deep, dark blue), correct?

If a batter swings at a pitch in a certain place 10 times over his career and never gets a hit, it would be the same color as the above (never swinging at a pitch), correct?

If a batter swings at a pitch in a certain place 100 times over his career and never gets a hit, it would be the same deep blue color as above (never swinging at a pitch), correct?

Yes and no. The process assume it's taking a sample from a finite region in space, and spreads the sample over that region based on the output of a spreading function. These "spreads" are then aggregated to give a weighted value for any particular region (this is in additon to the weight of the sample itself - its wOBA). It's a bit like averaging a series of contour maps superimposed on a neutral surface. You can see artifacts of the spread from pitches well away from the strikezone.

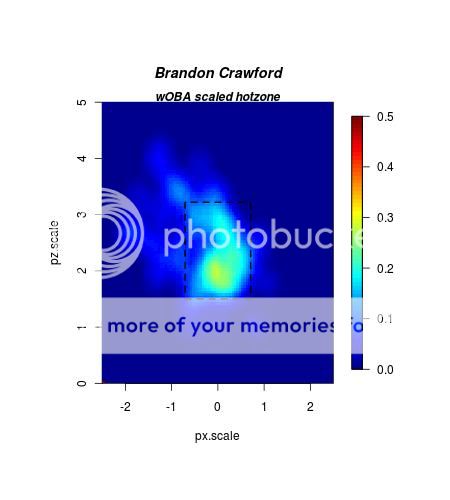
All that said, for those players with limited data, say less than 500ab, it's best not to automatically assume they can't hit a particular zone simply because it's deep blue - especially if it's within a zone of non-blue. You really should look at these maps as "where these players like to hit the ball", and not "where these players can't hit the ball". That's why they're labeled "hotzone" maps.

The color can't tell us *how often* a batter swings at a location, just his success when he does swing, correct? (Say, he swung 5 times and had a wOBA of 0.300 vs. he swung 500 times with the same wOBA.)

So (grouping all of the above) the heat maps don't show us a batter's *absolute tendencies* (how often he swings at a high pitch) just the success that he has had swinging at pitches in that location in the past? (And, by extension, the locations where said batter *should* be swinging, and which he should be avoiding.)

This data only includes at bats with results, e.g. a swing and miss on a 0 - 0 count is not reflected in this data. With that noted, the aggregation of "spread functions" function will reflect the density of data at that location. We should be able to tell the differrence between one data point and five hundred even if they have the same wOBA. Although it's certainly possible to have some ambiguity result from these operations with just the "right" combination of data. It's a balance in setting the granularity and spread of the sampling functions. And there is some subjectivity in the choice of those parameters, and, obviosuly, the modeling of the functions themselves, as can be seen in heat maps produced by other sources.

And just to be clear, it's possible to do heat maps that show swings and misses, fouls, and such; and I did one such map for Schierholtz last year to show he had closed his "down and in" hole.

And lastly, the heat maps don't indicate the type of pitch (low and outside was a fast-ball, slider, curve, etc), correct?

These don't, but it's possible to break it down by pitch type. I've got every bit of data generated by the mlb gameday/pitchfx system, so there is a large mutltitude of ways the data can be broken down. When there are questions about individual players it'll probably be worth taking a deeper look. And if there's a particular type of breakdown that is especially illuminating, I'll automatic the process so it can be repeated easily.

Again, thanks for the heat maps, and thanks in advance for helping me to understand them better.

:yo:
 
Last edited by a moderator:

MarcoPolo

Huge member
3,457
350
83
Joined
Mar 7, 2012
Location
San José, CA
Hoopla Cash
$ 1,000.00
Fav. Team #1
Fav. Team #2
Fav. Team #3
This data only includes at bats with results, e.g. a swing and miss on a 0 - 0 count is not reflected in this data. With that noted, the aggregation of "spread functions" function will reflect the density of data at that location. We should be able to tell the differrence between one data point and five hundred even if they have the same wOBA.

(Still trying to understand) So, if these are only ABs with "results", a player could swing at a fastball to the exact same spot 2 times, and as long as it didn't result in a hit or an out, it wouldn't be reflected in the heatmap? And if on the 3rd pitch (same spot) it was a HR, it would be "red hot" (even if the batter didn't even make contact the first 2 times)? Or if the first 2 pitches were hit over the fence but 10 feet foul, and the 3rd time it was an out hit to deep LF, it would reflect a wOBA of 0?

The discussion of 'the aggregation of "spread functions" function will reflect the density of data at that location' I didn't understand. If only "results" are shown, I don't understand how 'how often a player swings at that spot' could possibly be reflected in the map. Swinging just 10 times (but with 1000 pitches in that spot where the pitch didn't result in "a result") in an entire career at a letter-high fastball and getting 3 HRs would show up much "hotter" than swinging 100 times at a just-below-the-knees pitch (in 110 chances) and getting 30 singles (even though one rarely swung at letter-high fastballs).

Again, I'm trying to understand, not knock anything or anybody. Please explain how the picture shows the frequency of swings ("the differrence between one data point and five hundred"). I just don't understand. Please use small words. :lol:
 

ColinCoby

"Duff Man…Oh Yeah!"
8,493
28
48
Joined
Aug 10, 2010
Location
Sonoma County
Hoopla Cash
$ 1,351.63
Fav. Team #1
Fav. Team #2
Fav. Team #3
Brandon Crawford

BrandonCrawford.jpg

Kinda looks like an ultrasound.

Hopefully there's some red added to this soon.
 

Heathbar012

Senioritis Member
4,024
2
0
Joined
Aug 20, 2010
Location
San Luis Obispo, CA
Hoopla Cash
$ 1,000.00
Fav. Team #1
Fav. Team #2
Fav. Team #3
Pitching Coaches around the NL to their pitchers after showing their staff Burriss' heat map:

"Who that little guy? I wouldn't worry about that little guy."

Then they asked ManBur how he was feeling, and he said, "Good enough to fuck your mother!"

 
Last edited by a moderator:

gp956

The Hammer
13,846
1
36
Joined
Aug 11, 2010
Hoopla Cash
$ 1,000.00
(Still trying to understand) So, if these are only ABs with "results", a player could swing at a fastball to the exact same spot 2 times, and as long as it didn't result in a hit or an out, it wouldn't be reflected in the heatmap? And if on the 3rd pitch (same spot) it was a HR, it would be "red hot" (even if the batter didn't even make contact the first 2 times)? Or if the first 2 pitches were hit over the fence but 10 feet foul, and the 3rd time it was an out hit to deep LF, it would reflect a wOBA of 0?

Yes.

It's tempting to assign some value to a swing and miss, since it changes count leverage, and in a large enough sample I think we may be able to say it has some wOBA value. But this gets to the definition of wOBA and it's relationship to WAR. For instance, if count leverage has zero impact on wins, then any event that got us to a "result" would not be included as a linear weight in a wOBA calculation (and to be clear, it's not, but that is more about no one bothering to quantify count leverage and it's impact on wins).

Now also consider this: If we can imagine a hitter using the information derived from a swing and miss, such as gauging timing and ball movement, then it's not such a bad thing. Right? Also, some of the old-timers will tell you they would set up pitchers by intentionally swinging and missing at a particular location early so that they could get the same pitch in a high leverage situation later.

As for foul balls and such, currently we don't have access to data that would allow us to include that. But all that stuff is coming down the road, i.e. the speed and angle of the ball as it leaves the bat. It's being recorded now, but the data is proprietary to each club.

The discussion of 'the aggregation of "spread functions" function will reflect the density of data at that location' I didn't understand. If only "results" are shown, I don't understand how 'how often a player swings at that spot' could possibly be reflected in the map.

That's true. I mistakenly thought you were asking a different question there.

Swinging just 10 times (but with 1000 pitches in that spot where the pitch didn't result in "a result") in an entire career at a letter-high fastball and getting 3 HRs would show up much "hotter" than swinging 100 times at a just-below-the-knees pitch (in 110 chances) and getting 30 singles (even though one rarely swung at letter-high fastballs).

No. 30 singles is worth more than 3 homeruns.

Please explain how the picture shows the frequency of swings ("the differrence between one data point and five hundred"). I just don't understand. Please use small words.

It doesn't. I thought you meant one result vs. five hundred results. Remember: a data point here is the concluding event of an at-bat. A swing and a miss may or may not be a data point.
 
Last edited by a moderator:

gp956

The Hammer
13,846
1
36
Joined
Aug 11, 2010
Hoopla Cash
$ 1,000.00
Joey Votto vs. Emmanuel Burriss (hotzone envy). Note that Votto's hotzone is off the scale I used for the Giants.

JoeyVotto.jpg


EmmanuelBurriss.jpg
 

msgkings322

Throbbing Member
117,656
47,983
1,033
Joined
Aug 11, 2010
Hoopla Cash
$ 4,700.00
Fav. Team #1
Fav. Team #2
Fav. Team #3
Pitching Coaches around the NL to their pitchers after showing their staff Burriss' heat map:

"Who that little guy? I wouldn't worry about that little guy."

Rep to you and Heath for the awesome Super Troopers refs.
 

MarcoPolo

Huge member
3,457
350
83
Joined
Mar 7, 2012
Location
San José, CA
Hoopla Cash
$ 1,000.00
Fav. Team #1
Fav. Team #2
Fav. Team #3
MarcoTheClueless said:
Swinging just 10 times (but with 1000 pitches in that spot where the pitch didn't result in "a result") in an entire career at a letter-high fastball and getting 3 HRs would show up much "hotter" than swinging 100 times at a just-below-the-knees pitch (in 110 chances) and getting 30 singles (even though one rarely swung at letter-high fastballs).

No. 30 singles is worth more than 3 homeruns.

I must really mis-understand. I would have thought that 3 HRs in 10 chances ("that counted") would result in a higher wOBA than 30 singles in 110 chances. I guess I just don't understand wOBA. I would have thought that 3 HRs in 10 chances would be a wOBA over .500, while 30 singles in 110 chances would be a wOBA under .300.
 

gp956

The Hammer
13,846
1
36
Joined
Aug 11, 2010
Hoopla Cash
$ 1,000.00
I must really mis-understand. I would have thought that 3 HRs in 10 chances ("that counted") would result in a higher wOBA than 30 singles in 110 chances. I guess I just don't understand wOBA. I would have thought that 3 HRs in 10 chances would be a wOBA over .500, while 30 singles in 110 chances would be a wOBA under .300.

Ok. Swinging is not a result/chance in the context we've adopted here. It's a non-event in and of itself. Now, if what you're asking is, "would three homeruns in ten plate appearances recorded in a specific region have a higher wOBA value than thirty singles in one-hundred and ten plate appearances," the answer is yes.
 

MarcoPolo

Huge member
3,457
350
83
Joined
Mar 7, 2012
Location
San José, CA
Hoopla Cash
$ 1,000.00
Fav. Team #1
Fav. Team #2
Fav. Team #3
Swinging is not a result/chance in the context we've adopted here.

Then I mis-understood what you said earlier, I guess. I thought that you said that the heatmaps ony showed "at bats with results", and that a swing-and-miss wasn't counted. I thought that by that you meant that only pitches that resulted in an out or a hit were shown (i.e., only one pitch in each AB is reflected in the heatmap). Was that incorrect ? If so, could you use other words to describe what the heatmap shows please?
 

gp956

The Hammer
13,846
1
36
Joined
Aug 11, 2010
Hoopla Cash
$ 1,000.00
Swinging is not a result/chance in the context we've adopted here.

Then I mis-understood what you said earlier, I guess. I thought that you said that the heatmaps ony showed "at bats with results", and that a swing-and-miss wasn't counted. I thought that by that you meant that only pitches that resulted in an out or a hit were shown (i.e., only one pitch in each AB is reflected in the heatmap). Was that incorrect ? If so, could you use other words to describe what the heatmap shows please?

This is what you asked:

Swinging just 10 times [snip] in an entire career at a letter-high fastball and getting 3 HRs would show up much "hotter" than swinging 100 times at a just-below-the-knees pitch (in 110 chances) and getting 30 singles (even though one rarely swung at letter-high fastballs).

It was open to interpretation whether you meant swings or plate appearances (results/chances). I wasn't sure if the distinction had been understood, so I picked one interpretation and answered accordingly. And, yes, I picked the one I thought was slightly less probable, since a little bit of misunderstanding early can lead to more precise understanding later.

Do you understand conceptually what wOBA is, and how it is calculated?
 
Last edited by a moderator:

MarcoPolo

Huge member
3,457
350
83
Joined
Mar 7, 2012
Location
San José, CA
Hoopla Cash
$ 1,000.00
Fav. Team #1
Fav. Team #2
Fav. Team #3
Do you understand conceptually what wOBA is, and how it is calculated?

Yes. Which does indicate that only the last ball (put in play or a strikeout or walk) would count ( now that you rub my nose in it :rofl: ).
 

gp956

The Hammer
13,846
1
36
Joined
Aug 11, 2010
Hoopla Cash
$ 1,000.00
Yes. Which does indicate that only the last ball (put in play or a strikeout or walk) would count ( now that you rub my nose in it :rofl: ).

You brought up some good points about the maps that probably needed clarification.
 
Top